Most indicators are descriptive. The Square of 9 Wheel is predictive: a repeatable mathematical process that integrates time and price to identify turning points.
Numbers spiral clockwise from 1 at the center. The number 9 completes the first ring, hence the Square of 9. Circumscribed around the grid are the dates of the year.
Gann called it Time & Price Equality: markets turn when time and price are equal. Price points to time; time points to price. Like a Fibonacci spiral, it is a series of 90° turns inside squares.
When a price level "squares out" with a date on the wheel, expect a change in trend. It unlocks major trend changes and nails pivots for swing and short-term trades alike.
Plus hundreds of pivotal highs and lows in the key stocks we follow.
If you don’t believe that there is an internal DNA to the market, Jeff Cooper’s Gann studies will show that there absolutely is.
Jeff’s analysis of Gann cycles of time & price have consistently impressed me over the years.
My favorite thing about Hit and Run Trading is the discussions involving the Square of 9 Wheel.
When Jeff refers to a 30 to 40 year old chart to emphasize something, I pay attention.
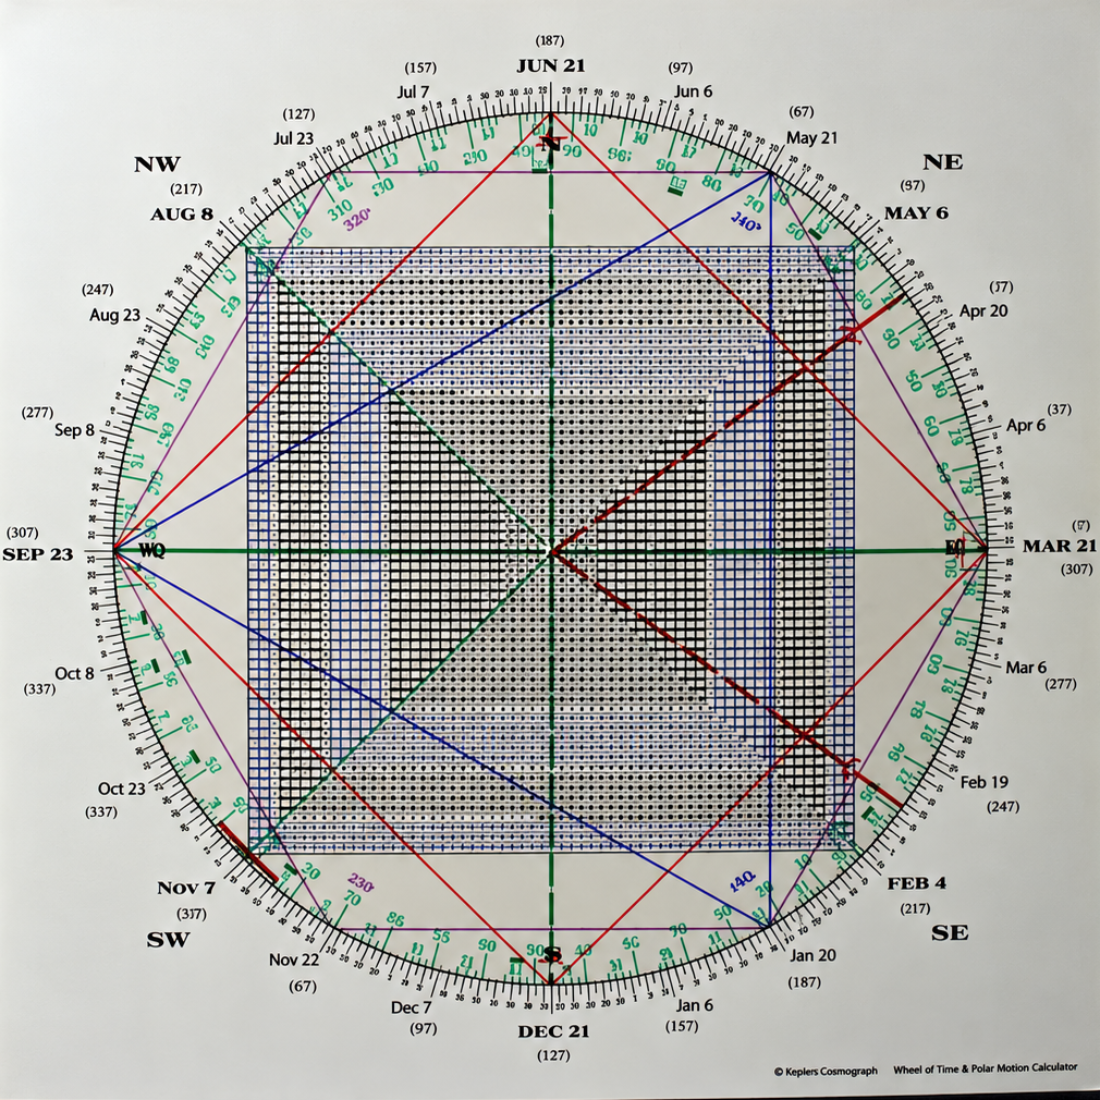
A visual representation of how time and price square out or "meet." The same wheel Jeff uses every morning.

 @JeffCooperLive